
Safe Operating Area (SOA) is one of the most important, yet frequently misunderstood specifications in power electronics. Understanding SOA can help designers avoid thermal issues, improve reliability, and ensure long-term system performance in applications that demand significant power delivered.
When evaluating an analog power amplifier or high-voltage analog component, engineers often focus on the maximum voltage and current ratings listed in the datasheet to understand power dissipation capability. While these specifications are important, they only tell part of the story. A device can operate well below its voltage and current limits and still fail unexpectedly if the combination of voltage, current, temperature, and time exceeds its Safe Operating Area (SOA). Understanding SOA and how to interpret SOA curves is essential for preventing thermal issues, improving reliability, and ensuring long-term performance in high-power analog applications.
What is Safe Operating Area?
Safe Operating Area defines the range of voltage and current combinations that a device can safely withstand without sustaining damage. Rather than evaluating voltage and current independently, SOA considers the power dissipated by the various combinations of output voltage and current while accounting for environmental operating conditions like case temperature and conditional variations like signal pulse width.
As voltage across a device increases, the amount of power dissipated within the device also increases. Likewise, higher output currents generate additional heat per P=I*V. The combined effect of voltage * current, temperature, and time determines whether the device remains within its safe operating limits.
For this reason, a device's maximum voltage rating and maximum current rating cannot simply be multiplied together to determine its usable operating capability, as one may expect. The actual safe operating region for a given device is often significantly reduced when compared to what the product of maximum current and voltage specifications might suggest.
Why Absolute Maximum Ratings Do Not Tell the Entire Story
One of the most common misconceptions in power amplifier design is that a device rated for 200V and 10A can safely deliver both simultaneously. In reality, that operating point would require the device in question to dissipate a sizeable portion of the 2,000 watts of instantaneous power delivered to the load, which could far exceed the thermal capability of the device package.
Maximum ratings are typically independent limits. This means that an absolute maximum of a device can be broached if it is the only specified maximum being approached in that instant. A device may safely handle its maximum voltage under light current conditions or its maximum current under low voltage conditions, but realistically never both maximums at the same time.
These kinds of design considerations are where the SOA curve for a given product or component becomes valuable. The SOA curve clearly illustrates the combinations of voltage and current that a device can safely tolerate and helps designers identify operating conditions that could lead to overheating, reliability issues, or failure.
How to Read an SOA Curve
Many engineers encounter Safe Operating Area graphs in datasheets but are unsure how to interpret them. Understanding how to read an SOA curve is critical when selecting a power amplifier for a demanding application.
The SOA graph plots VSUPPLY – VOUT (headroom) voltage on the horizontal axis and output current on the vertical axis. The area beneath the curve(s) represents combinations of operating conditions that a device can safely withstand. Any point above the curve represents a condition that may damage the device or reduce its reliability.
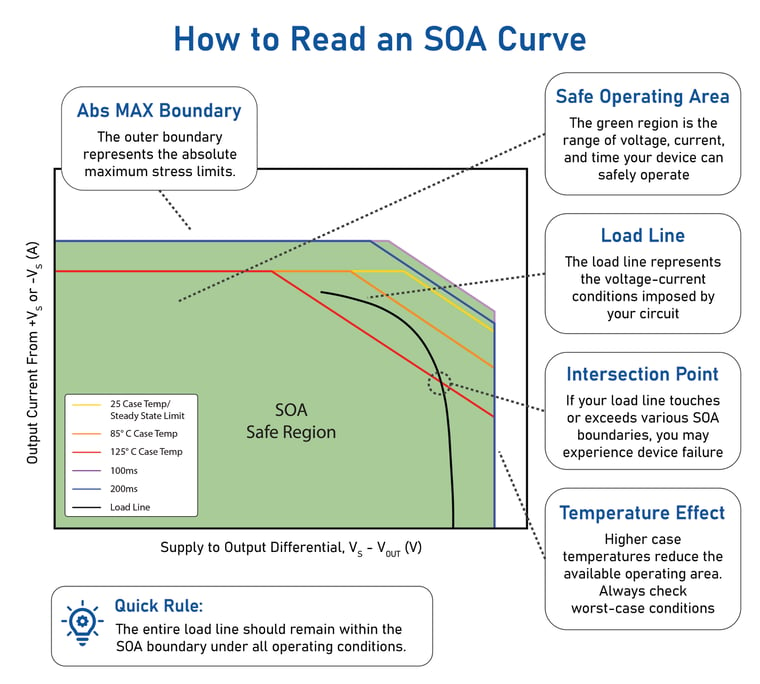
Figure 1: How to Read an SOA Curve
At lower headroom voltages, the curve is limited by maximum output current. As voltage increases, power dissipation becomes the primary constraint. Many SOA graphs also include multiple curves representing different pulse durations, showing that a device can often tolerate higher thermal stress levels for much shorter periods than it can when driven continuously by a DC signal.
When evaluating a power amplifier SOA graph, engineers should identify their expected supply voltage, output voltage and current and verify that the operating point remains comfortably within the published limits under both normal and worst-case conditions.
A Practical SOA Example
While understanding the shape of an SOA curve is important, it becomes much more useful when applied to a real operating condition. The following examples illustrate how an amplifier's operating load line can determine whether a design remains within its Safe Operating Area.
When evaluating a power amplifier, designers must consider not only the output voltage delivered to the load but also the voltage that remains across the amplifier itself. This voltage difference, combined with load current, determines how much power the amplifier must dissipate internally. As the output waveform moves through its operating range, the voltage across the amplifier and the load current continuously change, causing the operating point to trace a load line across the SOA graph.
Example 1: Operating Within the Safe Operating Area
In the following example (Figure 2), the amplifier operates from ±50V supply rails while producing an output swing of ±40V. This leaves approximately 10V of headroom between the output voltage and each supply rail. It is worth noting that when the output of an amplifier is swinging from the positive voltage rail limitation to the negative voltage rail limitation (rail-to-rail) the maximum internal power dissipation occurs at exactly ½ of the output peak voltage swing. In this example, while the voltage rails have been set to ±50V, the output voltage swing limitation of the amplifier used is + VSUPPLY – 10V and -VSUPPLY + 10V. This implies that the maximum achievable output swing of the amplifier with the stated voltage supply condition is ±40V. With that in mind, the areas of the output signal where maximum internal power dissipation takes place have been identified with their correlation on the SOA graph.
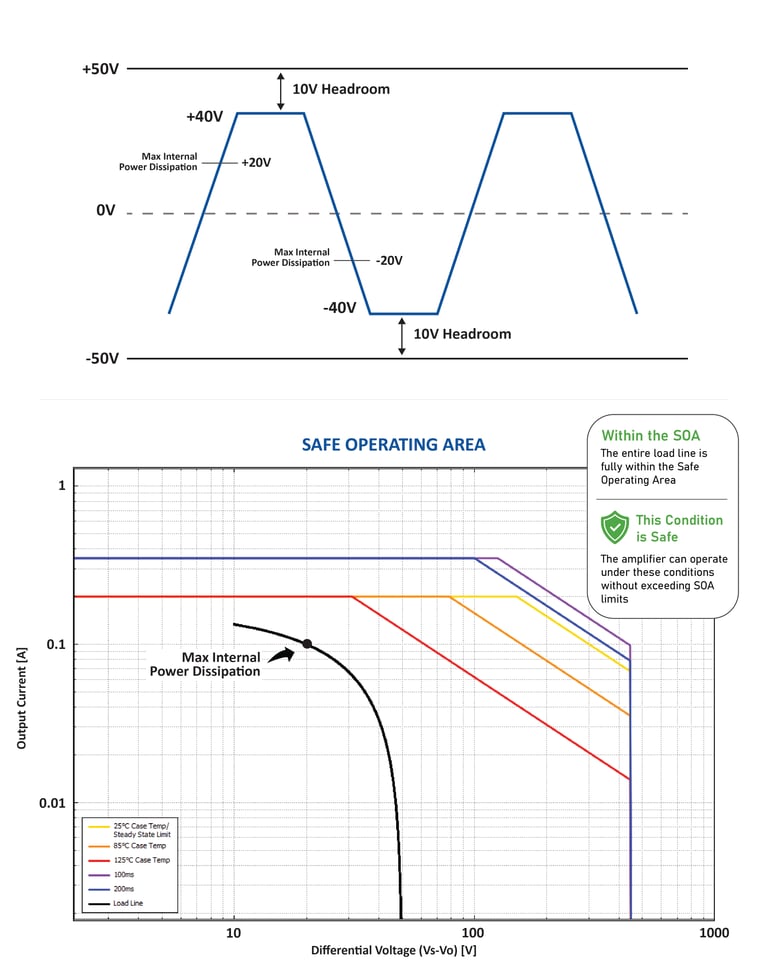
Figure 2: Example of a load operating within the amplifiers SOA
Because the voltage across the amplifier remains relatively low throughout operation, between 10V and 50V, the resulting operating load line stays within the device's Safe Operating Area. Under these conditions, the amplifier can deliver the required output while maintaining reliable operation.
Although the amplifier is dissipating power, the operating trajectory never exceeds the limits defined by the SOA curve. This provides sufficient margin for normal operation and helps ensure long-term reliability.
Example 2: Exceeding the Safe Operating Area
In this example (Figure 3), the amplifier operates from ±220V supply rails while producing an output swing of ±200V. Although the amplifier still maintains output headroom, the substantially higher supply voltage increases the voltage stress across the device and pushes portions of the operating load line beyond the SOA boundary. Maximum internal power dissipation has also been identified in this example in the same manner that it was explained for the previous.
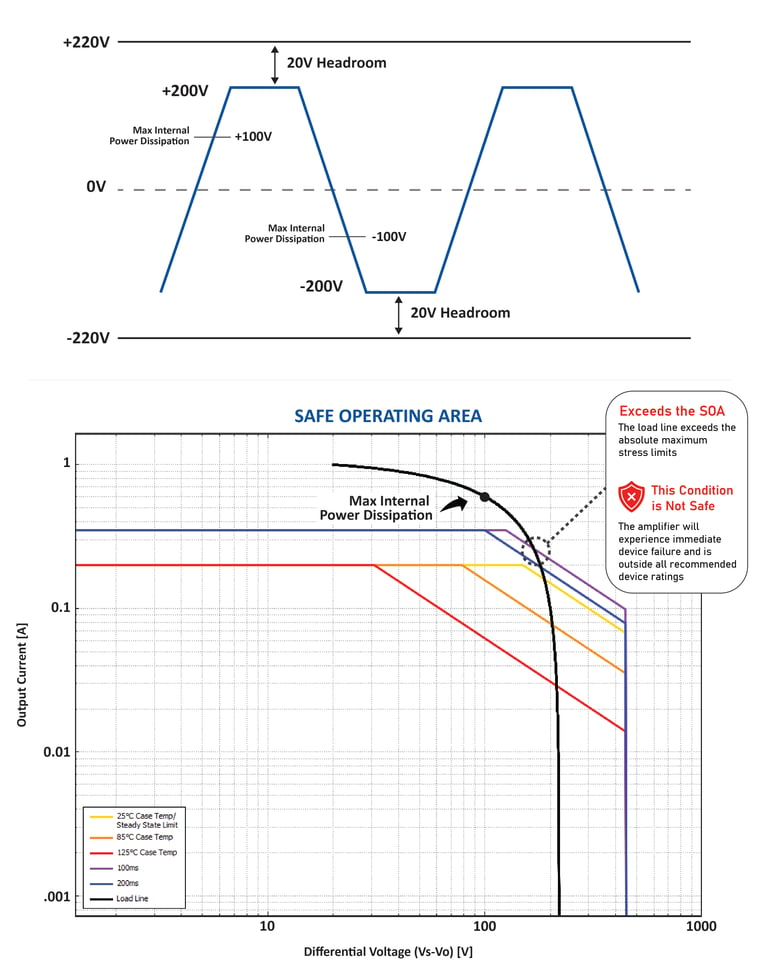
Figure 3: Example of a load operating outside the amplifiers SOA
As a result, portions of the operating load line extend beyond the Safe Operating Area boundary. Whenever an operating condition falls outside the SOA curve, excessive junction temperatures and localized device stress can occur.
Repeated operation in this region may lead to degraded performance, reduced reliability, or permanent device failure.
🌟Key Design tip: When reviewing a power amplifier datasheet, always compare your expected operating load line against the published SOA curve under worst-case voltage, current, temperature, and load conditions. A design that appears safe at room temperature may operate much closer to the SOA boundary at elevated temperatures.
SOA and Thermal Management
Although closely related, Safe Operating Area and thermal management are not the same thing.
Thermal resistance describes how efficiently heat moves from the semiconductor junction to the surrounding environment or attached heatsink material. Designers use thermal calculations to estimate junction temperature and determine cooling requirements.
SOA, on the other hand, defines whether a particular voltage-current operating condition is inherently safe for the device. Even a well-cooled amplifier may be vulnerable if it is operated outside its SOA.
Successful high-power analog designs require attention to both considerations. Staying within thermal limits helps maintain acceptable operating temperatures, while staying within SOA helps prevent localized device stress and long-term reliability concerns.
Designing with SOA in Mind
The best time to evaluate Safe Operating Area is during the earliest stages of system design. Waiting until hardware testing often reveals operating conditions that require significant redesign efforts, increasing development time and cost.
When reviewing a device datasheet, engineers should compare expected operating voltages, currents, pulse durations, and thermal conditions against the published SOA curves. Rather than focusing solely on maximum voltage and current ratings, designers should evaluate the complete operating load line and verify that it remains within the device's safe operating limits under both normal and worst-case conditions.
Engineers should also determine whether the application involves continuous operation or short-duration pulses. Many devices can safely tolerate operating conditions for milliseconds that would be unsafe if sustained continuously. Reviewing the appropriate pulse-duration SOA curves is especially important in applications involving transient loads, motor control systems, piezoelectric actuators, and pulsed test equipment.
Additional design margin, ideally 50% or more, should be incorporated to account for elevated ambient temperatures, manufacturing tolerances, load variations, and unexpected operating conditions. A design that appears safe under nominal conditions may operate significantly closer to the SOA boundary when subjected to real-world environmental and system-level stresses.
By considering SOA early in the design process, engineers can reduce risk, improve reliability, and avoid costly failures later in development.
Engineers evaluating high-power amplifier topologies may also benefit from understanding the differences between bridge and parallel amplifier configurations, since each topology can affect the voltage and current demands placed on the amplifier.
Safe Operating Area (SOA) FAQ
Can an amplifier exceed its SOA without exceeding its maximum voltage or current ratings?
Yes. Safe Operating Area considers the combined effects of voltage, current, power dissipation, temperature, and time. A device can remain below its individual maximum ratings while still operating outside its SOA.
Why do SOA graphs include multiple lines?
Many SOA graphs include curves for different pulse durations. A device can often tolerate higher voltage and current stress for short periods than it can during continuous operation.
Why is SOA important for power amplifiers?
Power amplifiers often operate under conditions where both voltage and current are high simultaneously. SOA helps engineers determine whether the amplifier can safely handle those operating conditions without overheating or experiencing long-term reliability issues.
Does temperature affect Safe Operating Area?
Yes. Elevated temperatures reduce a device's ability to dissipate heat and can effectively reduce its usable Safe Operating Area. Engineers should always evaluate SOA under worst-case thermal conditions rather than relying solely on room-temperature performance.
What is the difference between SOA and absolute maximum ratings?
Absolute maximum ratings define the individual voltage, current, and temperature limits of a device. Safe Operating Area (SOA) considers how these factors interact under real operating conditions. A device can remain below its absolute maximum ratings while still operating outside its SOA.
Conclusion
Safe Operating Area is much more than another graph buried within a datasheet. It provides critical insight into how a device behaves under real-world operating conditions and helps define the boundary between reliable performance and potential failure.
While voltage ratings, current ratings, and thermal specifications remain important, SOA brings all of these factors together into a practical framework for evaluating device capability. Engineers who understand and apply SOA principles are better equipped to build robust, reliable systems that perform as expected throughout their operational life.
Simplify SOA Analysis and Design with Confidence
Apex's free Power Design Software helps engineers visualize load lines on amplifier SOA curves and evaluate circuit stability, making it easier to identify potential operating limitations before moving to hardware.
For more resources on Safe Operating Area, refer to our application notes below:
- Apex Microtechnology